Limit CPU & Memory in Kubernetes
When we configure limits, it means that we tell the Linux node that the duration for a container application can run on a specified period. This is to protect the remaining resources from being entirely occupied by any application.
It is so important to configure CPU and Memory for services running on Kubernetes (K8S). We should understand what Limit and Memory are in K8S. We should not set resource too high for a pod as well as too low to be able to lead to service crashing. This article we hope that it will bring you a closer look about how to adjust the configuration for each service.
We have gathered this knowledge from online sources, if there are any mistakes, please comment for us.
CPU
Understanding Limit
When we configure limits, it means that we tell the Linux node that the duration for a container application can run on a specified period. This is to protect the remaining resources from being entirely occupied by any application.
Actually, we often confuse the CPU concept in K8S will be the number of CPU core that pod is assigned to run. However, the parameter specifies how long the group of processes and threads of a container can run before temporarily stopping to allow another container to run.
Limit will be the runtime of container. As far as we understand, the unit is used here 1 vCPU = 1000 milicores = 1 period. Assuming 1 period is equivalent to 1 second of CPU usage. Then, when container is configured cpu=1000m, it is able to use all resources of node in 1 second without any limitation before throttling container to give another container to use resources.
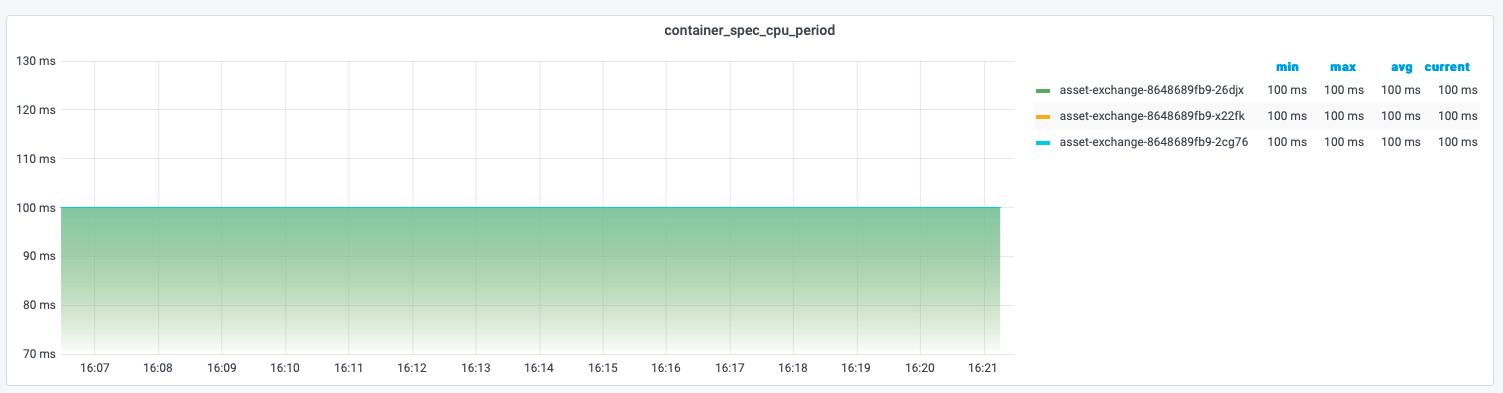
We can get a period of a container by metric container_spec_cpu_period is exported in Prometheus. Here we can see that period of a container is 100 ms
With cpu=8000m configuration, it is equivalent that this container will take 8 period = 800ms to run on the node. Here we can see 800ms by metric container_spec_cpu_quota.
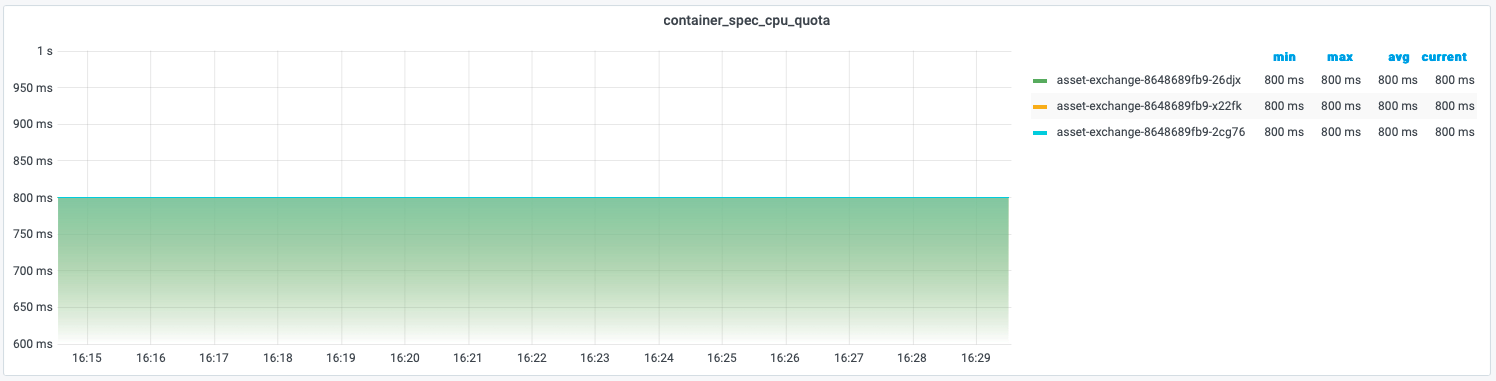
resources:
  limits:
    cpu: "8000m"
Understanding Throttling
In short, throttling is the progress of temporarily pausing container and waiting for the next period. If CPU configuration is too high, it will result in that pod spend too many resources of node and cost to maintain service. If the cpu configuration can not handle the tasks within a period, these tasks will be stopped and wait for the next period to handle. It means that these tasks will be increased latency due to pausing.
For example, a task in service has to take 100ms to complete. But the service only configures 0.4 period = 40ms. It means the service need to take 40ms (app) + 60ms(idle) + 40ms(app) + 60ms(idle) + 20ms(app) ~ 3 period = 220 ms
We can monitor whether the container is throttling and how much by container_cpu_cfs_throttled_periods_total
# unit is none in prometheus
sum(rate(container_cpu_cfs_throttled_periods_total{container="$container", pod=~"$pod"})) by (pod)
This measurement can explain that pod is slowing and how the throttling cpu is slow. However, usually, we should monitor the percentage of CPU usage to do increase the number of pod or increase CPU limit to ensure the service is stable. The below query, we can measure how many the percentage of use usage is
sum(rate(container_cpu_usage_seconds_total{name!~".*prometheus.*", image!="", container="$container", pod=~"$pod"}[5m])) by (pod, container) /
sum(container_spec_cpu_quota{name!~".*prometheus.*", image!="", container="$container",pod=~"$pod"}/container_spec_cpu_period{name!~".*prometheus.*", image!="", container="$container",pod=~"$pod"}) by (pod, container)
Memory
With memory, we should note request and limit. A pod is scheduled based on request. A pod is scheduled on a node, when that node has enough available memory which pod request. A pod is allowed to exceed request if the memory of node is available. However, a pod is not allowed to exceed the limit. When pod exceeds the limit or request on which node does not have enough available memory, then the pod will become the candidate for termination.
We need to note when setting the limit of memory for pod. Because the application and os (usually Linux) are using the same memory resource. When we set the major of memory to application, and not account for the operating system, it can cause OOM Kill for pod. Besides that, when working with JVM of Java we often just pay attention to heap memory but forget that a thread will take 1 MB stack memory, and it does not account for heap memory. Assuming our 1G pod contains a 500 MB heap java application run with 500 threads then it takes 500 MB outside the heap memory and pod run out of the memory, and finally, the pod is killed due to OOM Kill.
Usually, OOM Kill occurs when the application suffers a massive ingress and immediately being OOM kill. So, the measurement JVM will not show the reason for OOM Kill and make us confused that the application was killed due to K8S having just some issues that resulted in OOM kill. We can measure the memory of pod by container_memory_usage_bytes (byte)
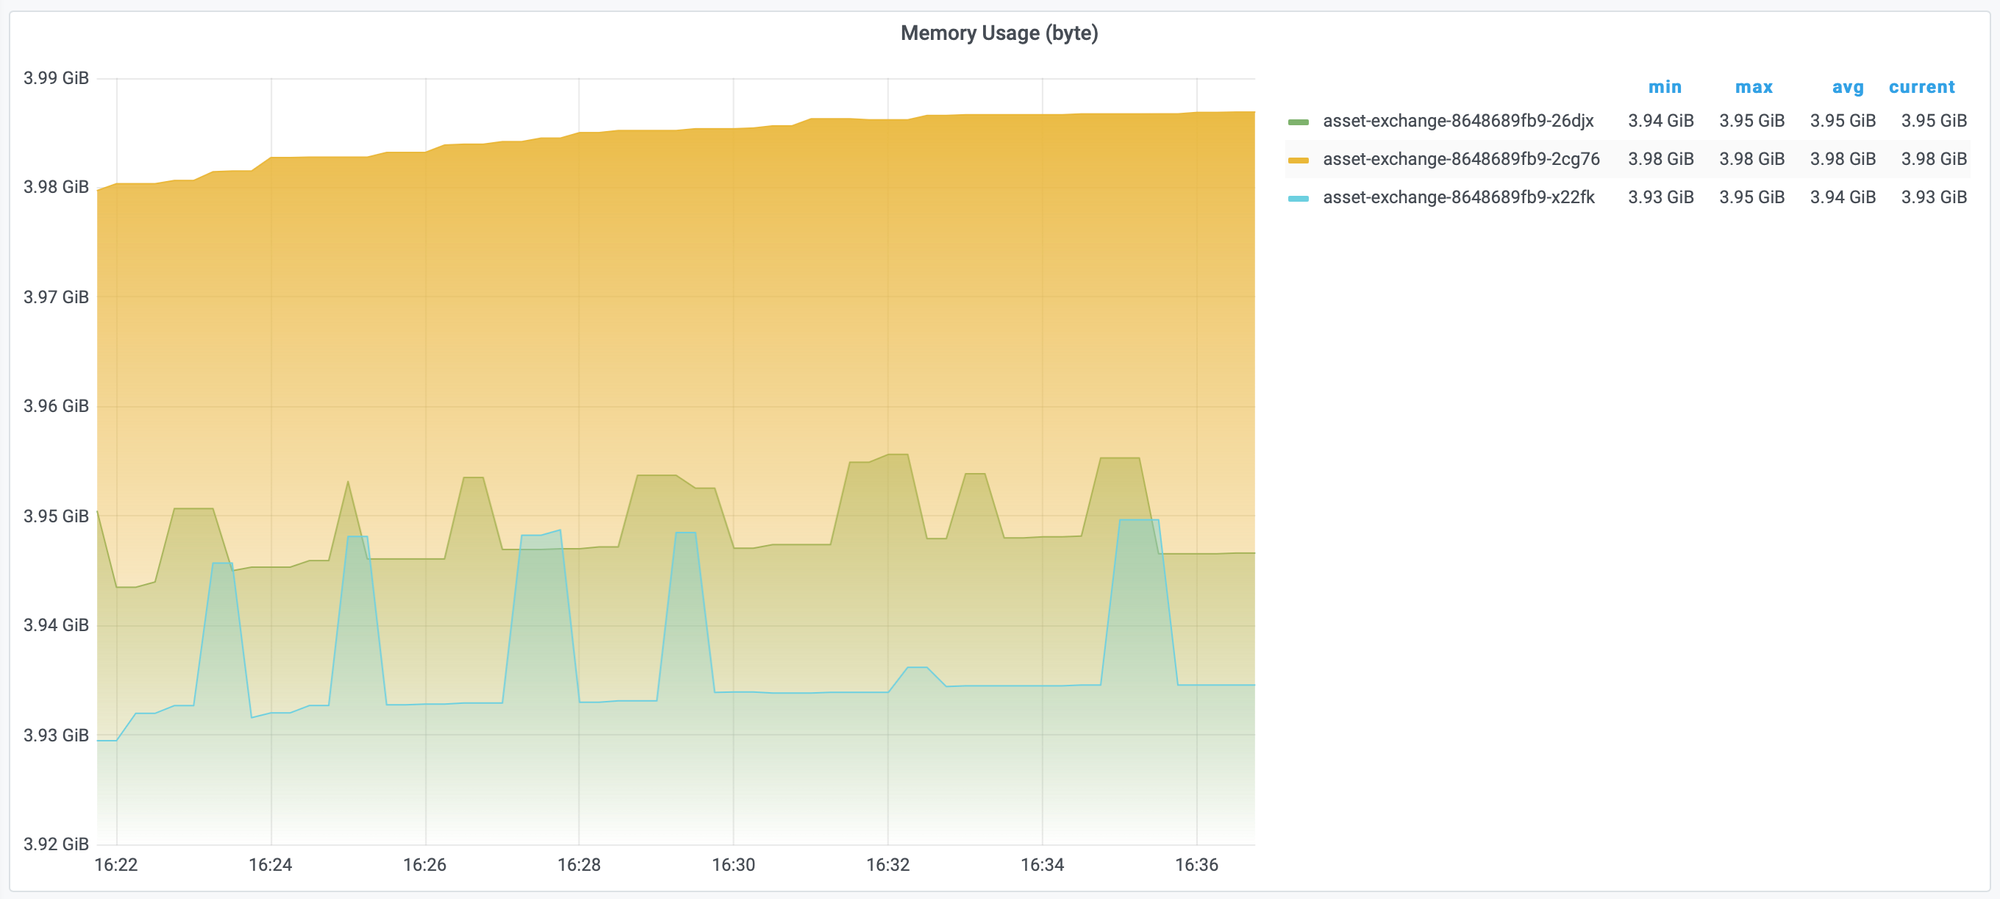
# unit byte
sort_desc(sum(container_memory_usage_bytes{image!="", container="$container", pod=~"$pod"}) by (pod))
However, with this measurement, we can have trouble to decide that whether pod is ok. Because it does not show the limit of the pod. So, we should measure the percentage of memory usage.
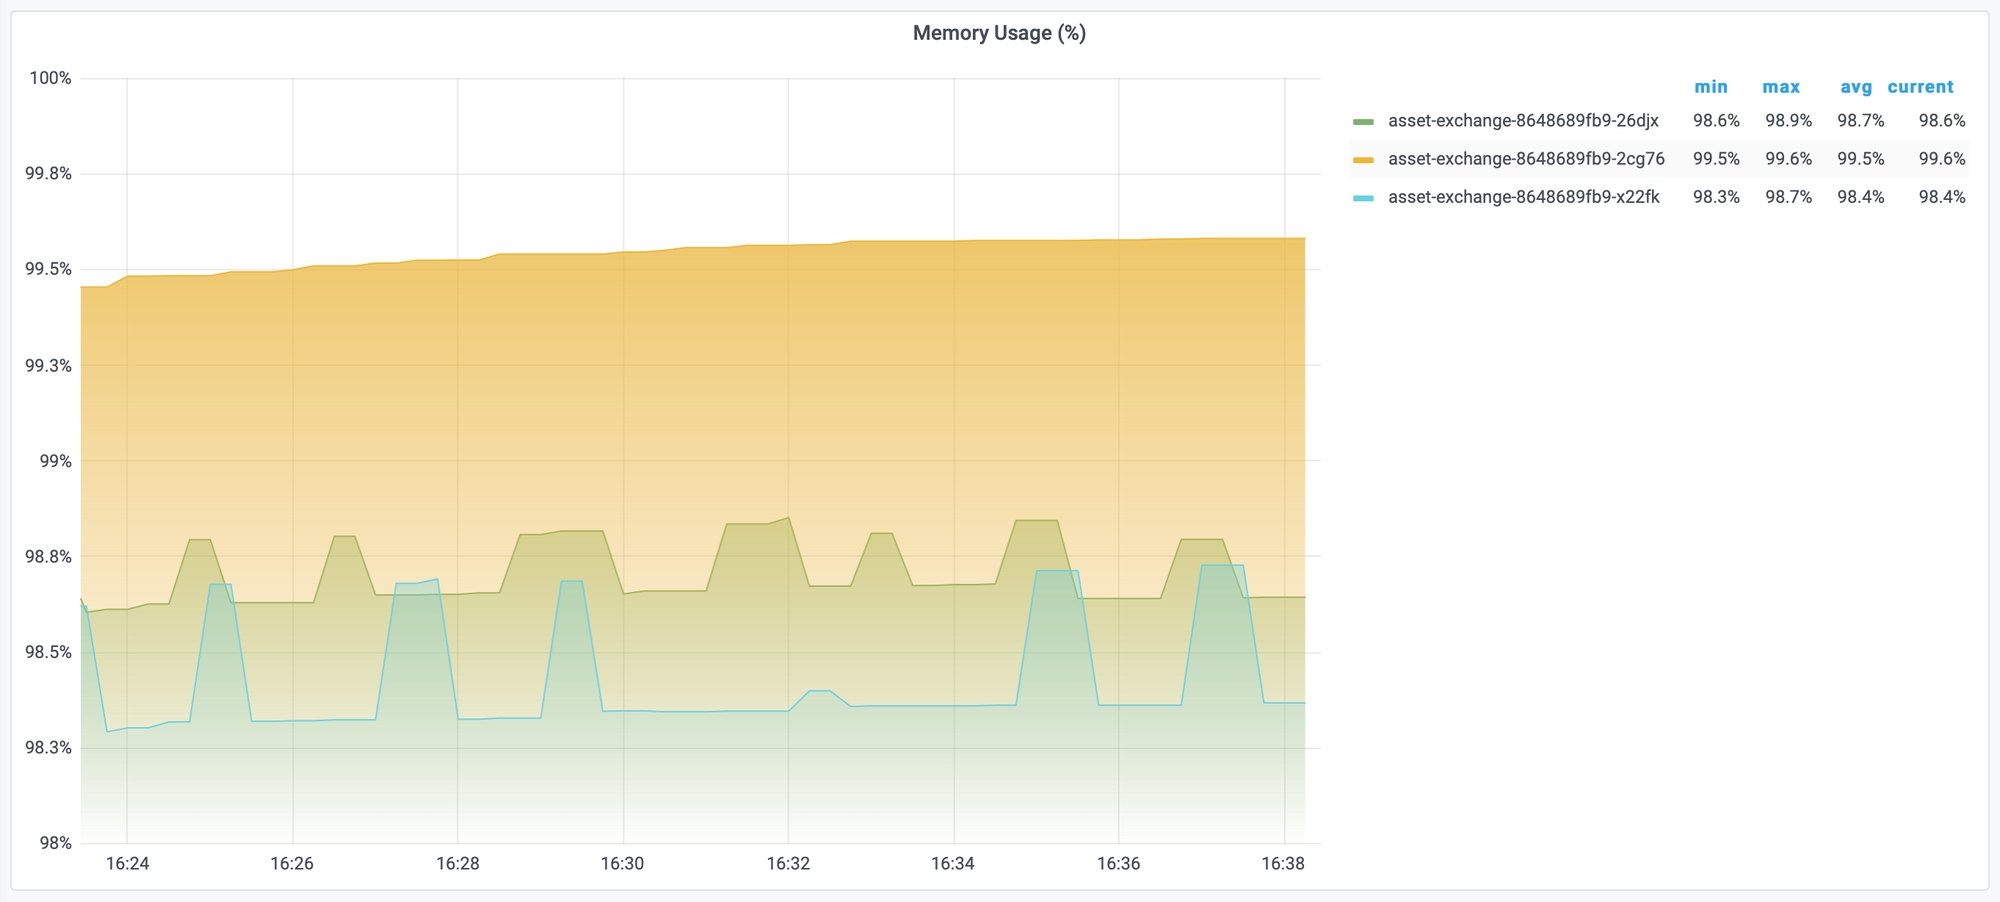
# unit percent (0.0-1.0)
sum(container_memory_usage_bytes{container="$container",pod=~"$pod"}) by (pod) / sum(kube_pod_container_resource_limits{container="$container", pod=~"$pod", unit="byte"}) by (pod)
Conclusion
We went through the concepts of Limit and Memory in K8S as well as ways to understand and measure them. Understanding these parameters can help us make better decisions about configuring the number of resources needed for each service. In case the service has a resource problem, we will also better understand the cause to find a way to fix it.