Chaos Engineering in Accounting Engineering team
Chaos Engineering helps us enhance system resiliency at scale
Being at the heart of ZaloPay systems, the Accounting Engineering team is responsible for building a scalable ledger to manage accounts & money movements. In 2021, our systems were capable of handling 1500 tps effortlessly. In 2022, in addition to handle 3000 tps, we also aim to protect data from natural disasters (required by Section 9, Circulars 09/2020/TT-NHNN issued by State Bank of Vietnam).
We’ve been paying so much attention to ensuring System Resilience since day one. Failure modeling is a must in our design specifications to deal with distributed failures. Defensive design principles such as circuit breaking and two-phase commit protocol (2PC) are widely discussed & understood by members. Code has high test coverage for critical paths. Still, we had troubles. In 2020, we had an unforgettable incident due to a Split-Brain scenario in Apache Ignite, our in-memory cache.
As ZaloPay’s moving to the cloud, systems will have emergent behaviors, responding to various production conditions by scaling up and down in order to make sure the application can deliver a seamless experience to increasing customer demands. This further complicates system reliability.
Problems
Software testing works well with the expected but not with the unexpected. For example, unit tests verify if our code does what it’s supposed to. Integration tests verify if code plays nicely with others & conforms to specifications. But which tests to verify if your distributed systems work when the network is split into half?
Failure modeling is also based on our past knowledge. We couldn't predict states of an ever-growing complex system under all circumstances. Unexpected failures can be one of the following:
- Applications run out of memory.
- Network partition happens when a router is broken
- A physical node is down
There are always unknown failures that we don’t know (the unknown unknowns). This somehow reminds me of “The Five Orders of Ignorance” (Phillip G. Armour, Communications of the ACM, October 2000, Vol. 43)
So, the hard part of building systems is not building them, it’s knowing what to build—it’s acquiring the necessary knowledge. This leads us to another observation: if software is not a product but a medium for storing knowledge, then software development is not a product-producing activity, it is a knowledge-acquiring activity
Fault Injection & Chaos Engineering
“What doesn’t kill you make you stronger”, Friedrich Nietzsche
We can inject failures into our systems to validate their resilience. For example: we may abruptly terminate a cluster node, introduce a delay when network packets cross our proxy.
This is not new. In 2011, Netflix debuted its open-source project, Chaos Monkey, a tool to randomly terminate running instances. Chaos Monkey helped Netflix verify if their infrastructure could tolerate sudden and unexpected failures. Later in 2014, Netflix introduced Failure Injection Testing (FIT) platform, which was an orchestrator to inject faults at a larger scale of and across many teams. The monkey and its friends laid the foundation for Chaos Engineering, a technique for learning about how your system behaves by applying the discipline of empirical exploration. Through exploration we gain more knowledge about the unknowns.
The technique has 4 steps:
- Define the ‘steady-state’ observable via metrics
We use Prometheus/Grafana as the monitor and define the system’s steady-state by observing and collecting critical metrics of a stable cluster. For example, our system is considered stable when no balance-mismatch is detected.
2. Develop a hypothesis based on steady-state
Make a list of hypotheses of certain failure scenarios and what we expect to happen. For example, our system works properly when a Redis-slave node is isolated from the network
3. Create experiments that reflect real-world incidents:
Run the experiment to prove or disprove the previously identified Hypothesis. During this process, it is necessary to simulate possible faults such as network errors, service termination, out of resources… For example: While the system is processing, create a network partition between a Redis-slave node and the others in the Redis cluster.
4. Evaluate the observations
When the experiment failed, it is important to figure out the reasons "why" the experiment failed. In order to determine the root cause, service observability plays an important part. We may see an abnormal log or a spike in our monitoring metrics.
For more information, we recommend you to read the book “Chaos Engineering: System Resiliency in Practice” by Casey Rosenthal & Nora Jones.
Chaos Engineering at our team
Jepsen
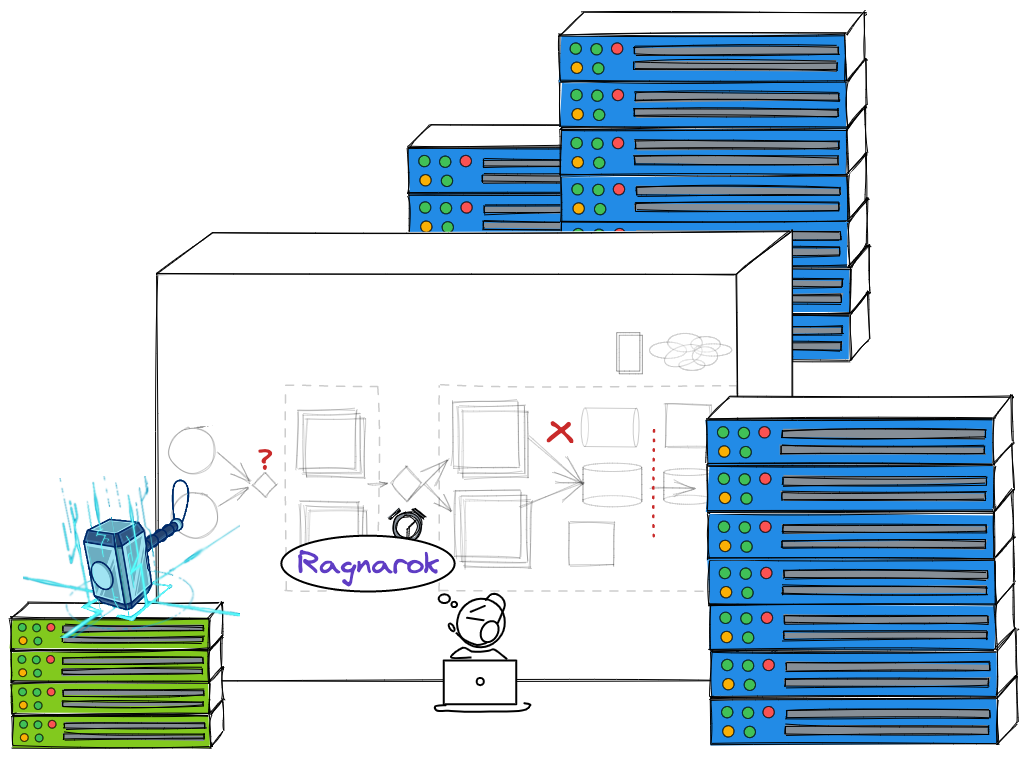
Initially in 2019 we adopted Jepsen, an open Clojure framework for distributed systems verification. Jepsen is well known for their public analyses for various safety issues in prominent systems like ScyllaDb, Redis, PostgreSQL, MongoDb. At that time, we used Jepsen to validate our New SQL database (Tidb). Not knowing about Chaos Engineering, we used the spirit of Jepsen to build Ragnarok, a system to verify the very first version of our ledger which is a database too.
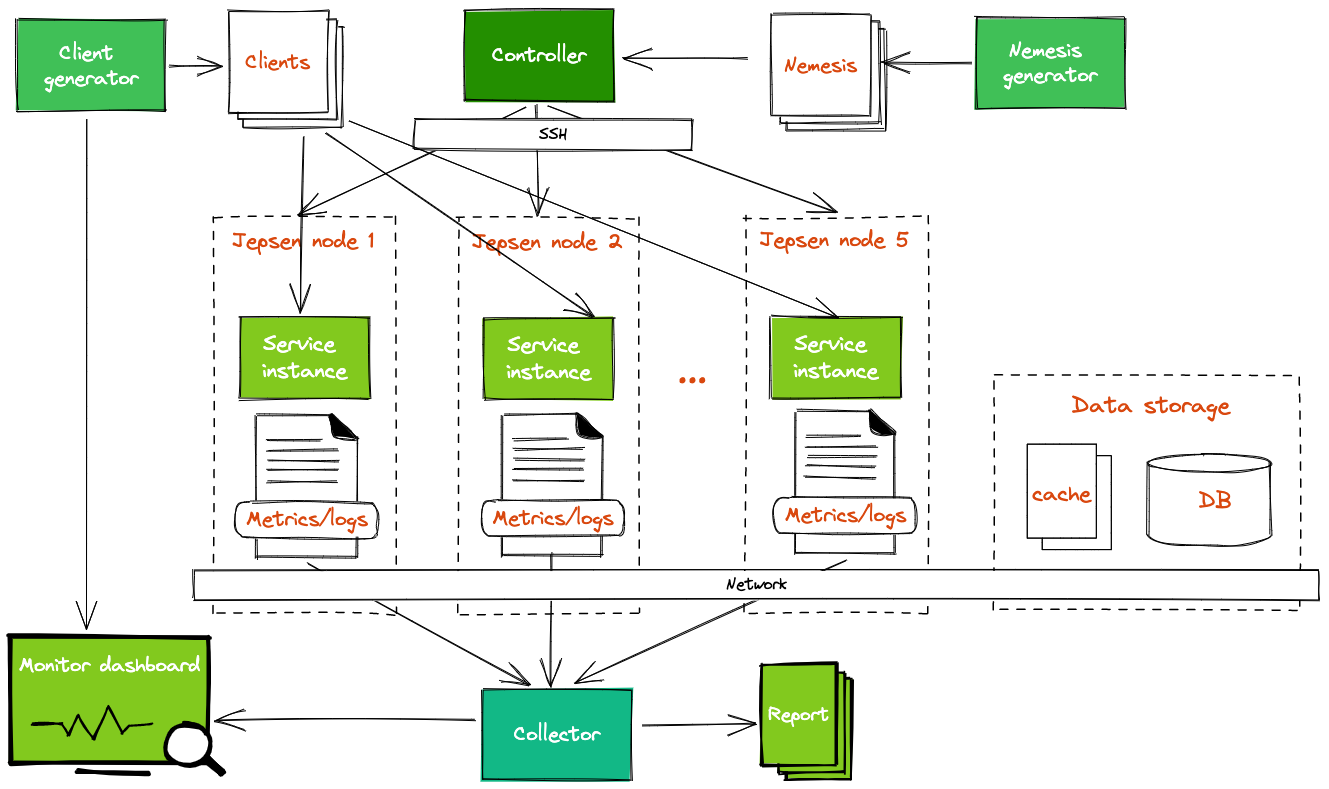
A Jepsen experiment runs as a Clojure program on a controller node. That program controls other nodes through SSH, where it sets up the entire system to test. To start new experiments, we have to define the workload including
- Client: we use a separate service to simulate the client requests
- Nemesis: to generate unexpected faults
- Bootstrap: How to warm up service and dependencies, for example: database, cache.
- Validation: How to validate the correctness: we validate based on the response status, system metrics, and the data correctness in database (record logs, user balance)
Jepsen helped us to uncover the Split-Brain issue four days before it happened in production. Unfortunately, we didn't fully evaluate observations from the tests and couldn’t fix the bug on time.
To prevent further incidents like this, we are aware that we should be more serious about chaos engineering and after that, we have to spend more effort on researching and applying this technique in practice. We realized Jepsen learning curve is steep, writing each Nemesis in Clojure is not easy. Only one guy in our team knows Clojure. We want to make Chaos experiments easier for every member to use
Chaos Mesh
Recently Chaos and Reliability Engineering techniques are gaining traction as essential disciplines to building reliable applications. As we move deeper into Kubernetes and Cloud ecosystems, there’s a blossom of Cloud-native frameworks & products for chaos engineering, for e.g.: Litmus, Chaos Blade, Chaos Mesh, Gremlin.
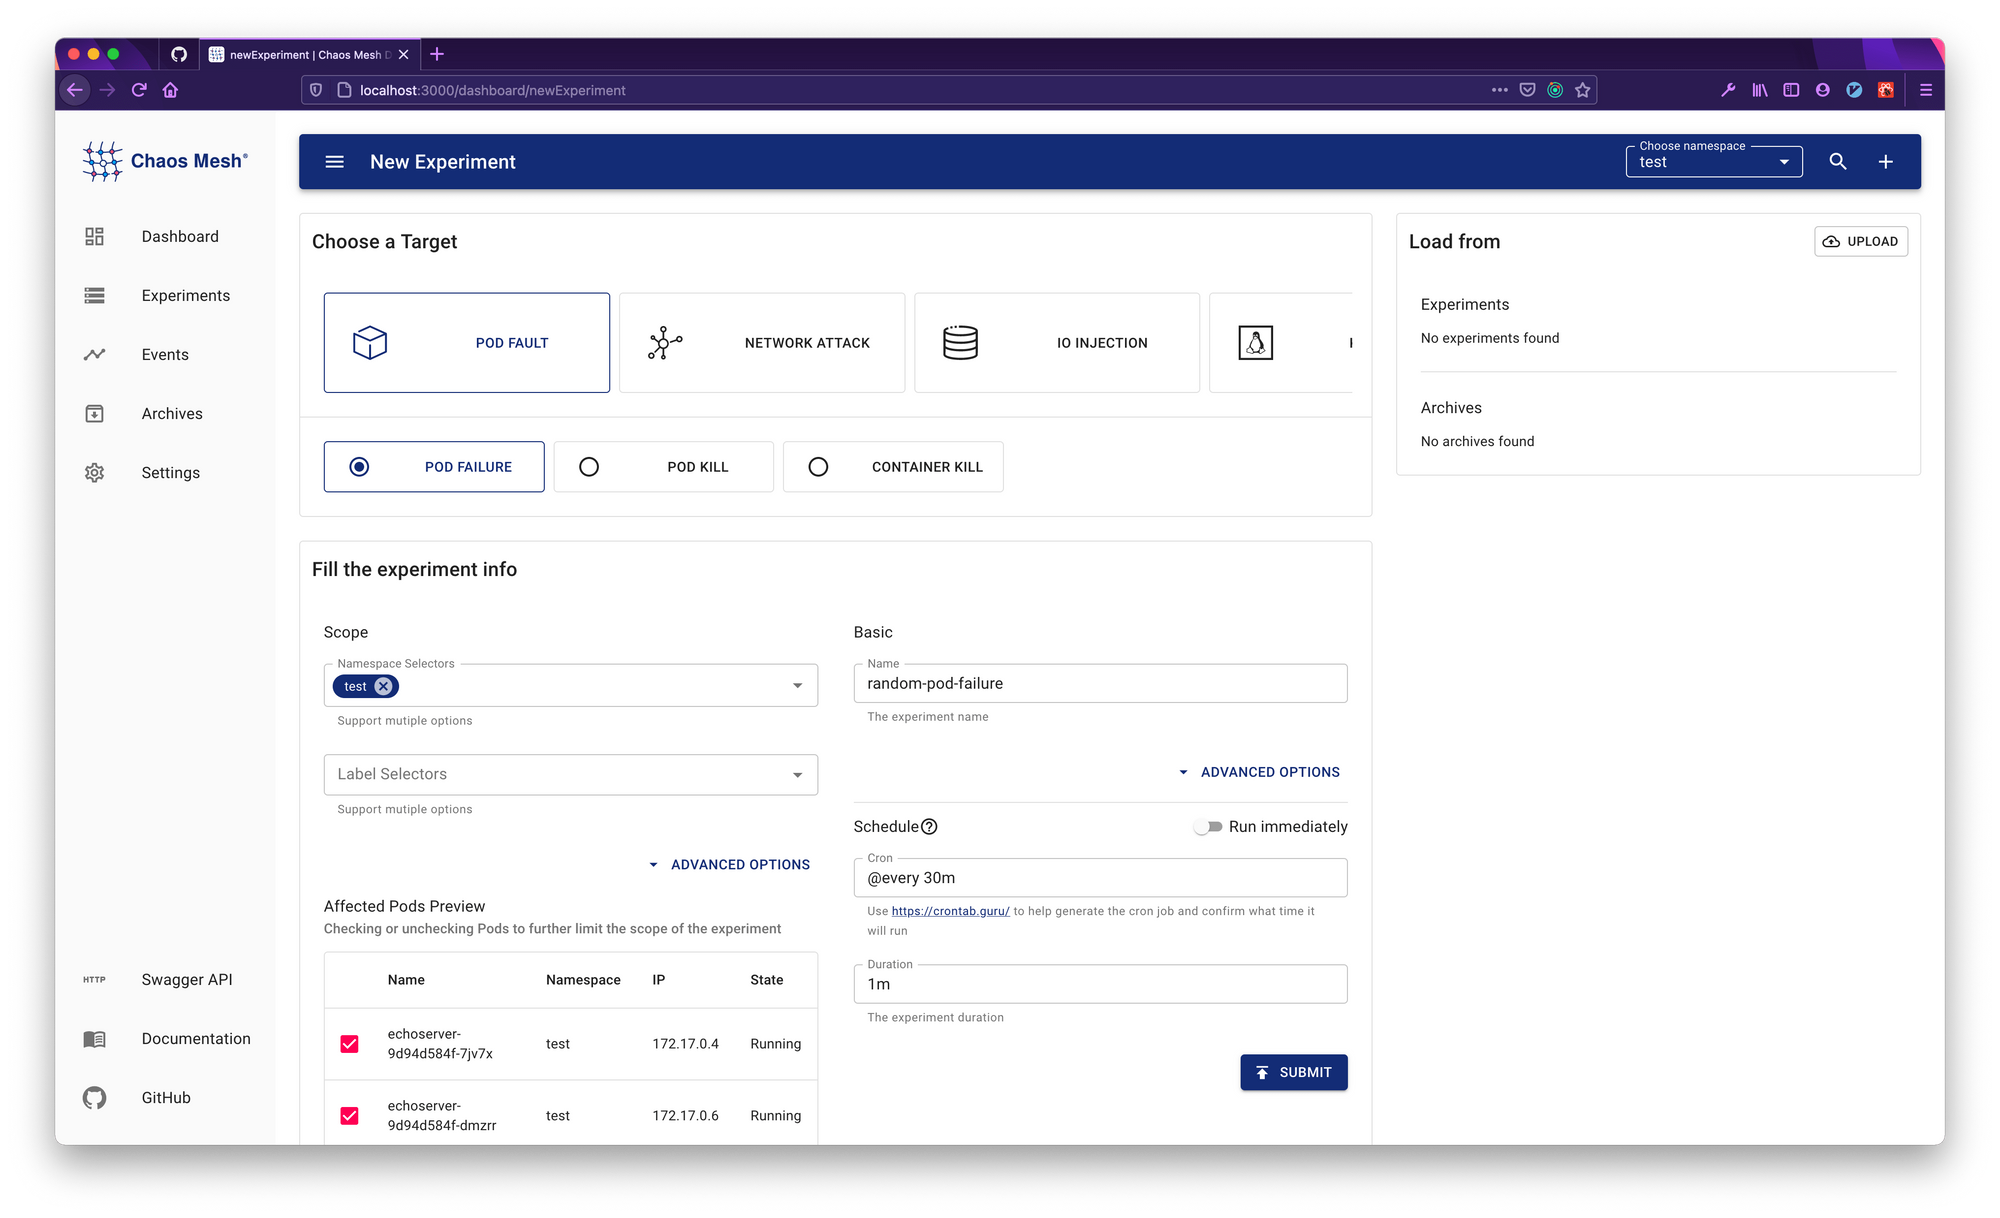
We decided to evaluate an open framework first and Chaos Mesh was chosen. Chaos Mesh was created by PingCap, the company behind Tidb, to ensure their own database safety. The intuitive Chaos Dashboard interface makes it easy to get started. From a single member, now everyone in our team can run their own experiments.
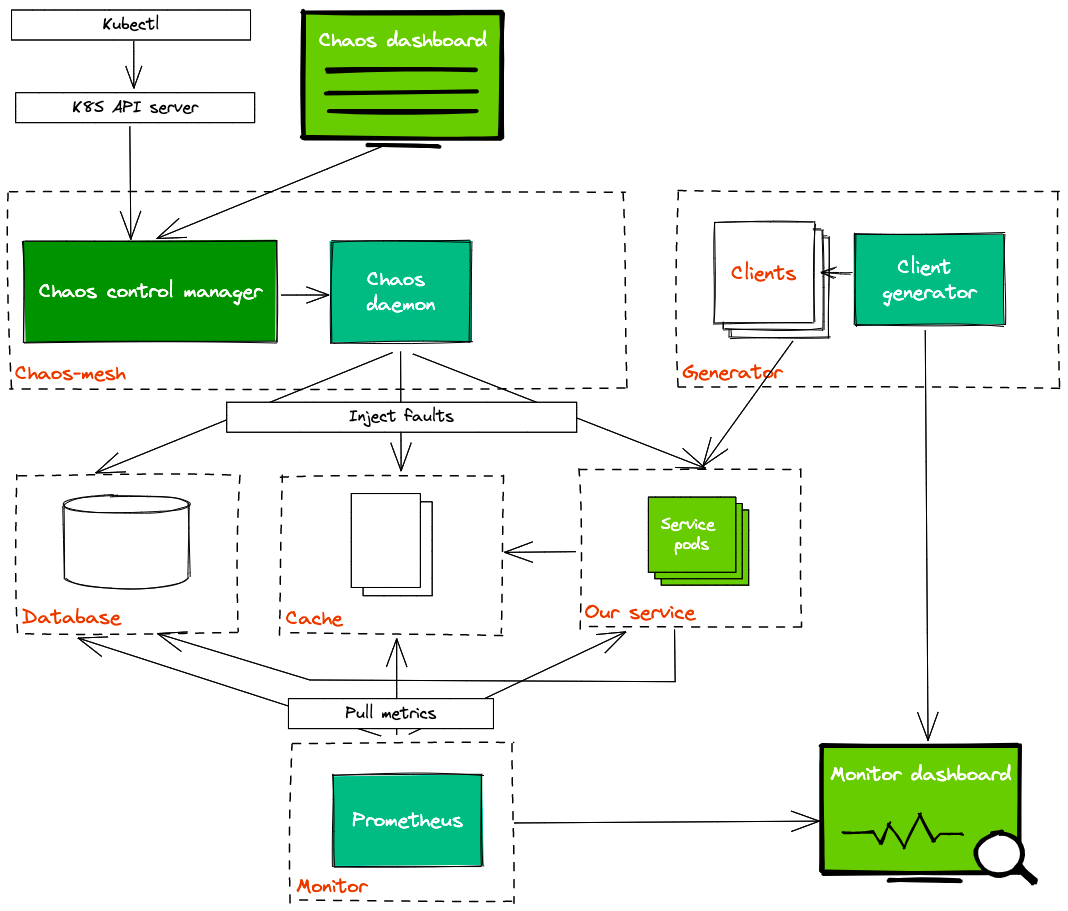
The overall architecture of Chaos Mesh can be divided into three parts from top to bottom:
- User input and observation: User input reaches the Kubernetes API Server starting with a user operation (from chaos dashboard or kubectl). Users do not directly interact with the Chaos Controller Manager. All user operations are eventually reflected as a Chaos resource change (such as the change of NetworkChaos resource).
- Monitor resource changes, schedule Workflow, and carry out Chaos experiments: The Chaos Controller Manager only accepts events from the Kubernetes server. These events describe the changes of a certain Chaos resource, such as a new Workflow object or the creation of a Chaos object.
- Injection of a specific node fault: The Chaos Daemon component is primarily responsible for accepting commands from the Chaos Controller Manager component, hacking into the target Pod's Namespace, and performing specific fault injections. For example, setting network rules, and starting the stress process to preempt CPU or memory resources.
Via the Dashboard, we can customize experiments in terms of: faults injection, burst radius of the failure, schedule of the failure... Chaos Mesh also supports Kubernetes CRD-based chaos types that we could use in existing Helm charts and deploy all of the components on a Kubernetes cluster. Unfortunately, Chaos Mesh doesn't support log-collecting mechanism so we have to do it by using a separate service (like Splunk/Kibana) or manually checking through the Kubernetes dashboard.
We have found more than 10 bugs and risks in our ledger. The notable thing is discovering a safety bug in Redis. Our engineer also contributed to fixing the bug via pull request #10160. If you care about Redis safety, please update to the latest stable version of 6.2.7.
Lessons learned
- Unknown failures can come from any dependency on your systems.
- Knowledge explored by Chaos Engineering helps us to enhance Failure modelling.
- Developer Experience is crucial to adopt a framework.
What’s next?
Still, we’re on a journey to explore what we can do with Chaos Engineering to enhance our system resiliency at a larger scale. As a part of the Shift-Right testing approach, which performs tests in a production environment in a safe manner, we’ll evaluate other options and integrate the appropriate one in our CD pipelines.
Acknowledgements
We would like to thank all engineers who have been collaborating to guarantee the ledger quality. Special thanks go to Nguyen Quoc Anh and his works on Ragnarok.
Interested in working with our Accounting Engineering team, or with other engineering teams in ZaloPay? We're always hiring.